New optical technologies increase the demands on the engineering specifications of optical surfaces, with manufacturing specifications of up to 1nm RMS form accuracy and 0.1nm RMS surface finish. To achieve these fabrication requirements novel ultra-precision methods must be developed. The proposed solution is microwave generated activate plasma figuring.
StudentSupervisor |
Project presentation |
Aim
Implement a microwave generated reactive plasma torch that will enable the
ultra-precision correction of surface errors on optics. The tool will be easily implemented into an existing manufacturing chain and will target 1mm3/min material removal rates.
Objectives
- Establish the design rules of atmospheric pressure microwave plasma systems;
- Commission and implement a microwave plasma torch;
- Prove the deterministic nature of the material removal function;
- Demonstrate the rapid ultra-precision surface correction capability of the microwave plasma torch, over the entire surface of an optical component;
- Optimise the technology for processing crystal quartz.
Applications
Background
New technologies in aerospace, defence and science applications increase the demands on the engineering specifications of optical surfaces. Optical surfaces are required to be manufactured to 1 nm RMS form accuracy and 0.1 nm RMS surface finish. The fabrication of these optical systems requires novel ultra-precision manufacturing technologies.
These papers focus on a bespoke Energy Beam (EB) based fabrication process. This EB process is created to achieve the technical specifications that are required for the next generation of ultra-precision photonic surfaces. The proposed EB is generated by electromagnetic waves. Electromagnetic energy transfers into a plasma jet at atmospheric pressure. Generation of electromagnetic waves by solid state technology yields ultra-precise frequency control of the electromagnetic waves coupling with the gas and hence a plasma jet is discharged with higher stability. One of the key features of this novel EB is its capability to process silicon based optical materials.
Characterisation of atmospheric pressure Coaxial Electrode Microwave Induced Plasma technology
1. Introduction
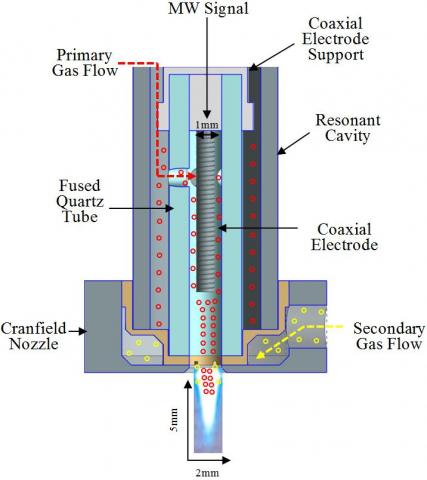
Microwave Induced Plasma (MIP)1 technology generates plasma through the inductive transfer of energy from standing waves within a resonator. One clear distinction that enables an observer to identify an MIP system from alternative microwave plasma technologies is the presence of a dielectric tube that is located within the resonant cavity. MIP systems have become the principal technology in the microwave plasma sector and the design typically employed for discharging atmospheric pressure plasma jets involves the use of a coaxial electrode to launch the microwaves into the gas, this design is called
Coaxial Electrode Microwave Induced Plasma (CE-MIP)2 technology.
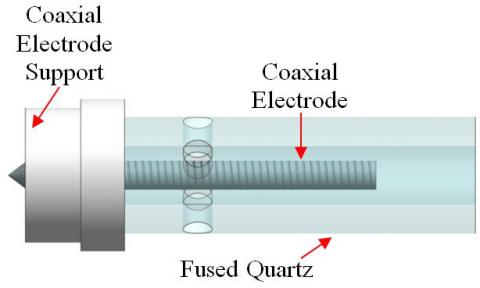
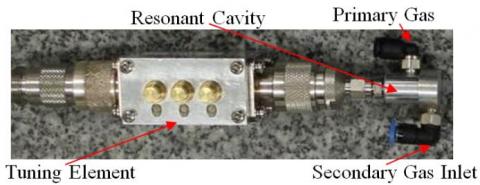
Figure 1 Coaxial electrode enclosed within a fused quartz tube shows an example of the coaxial electrode arrangement. The holes in the fused quartz tube allow gas to flow into the quartz tube. Figure 2 Adtec Coaxial Electrode Microwave Induced Plasma torch shows the CE-MIP torch manufactured by Adtec.
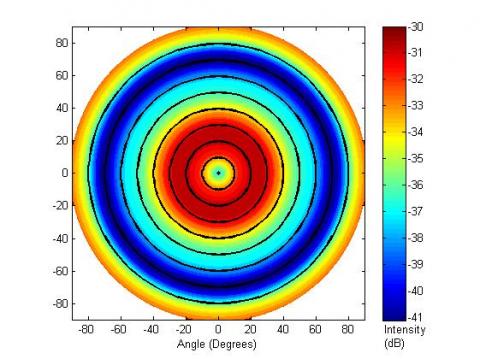
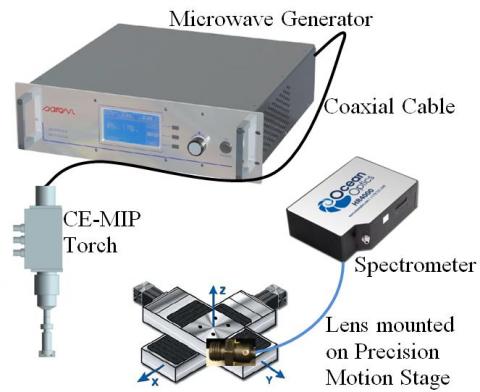
This paper develops a novel characterisation process for the development of CE-MIP technology. Firstly, microwave spectrum analysis3, 4 was used to create a polar plot of the microwave energy being emitted from the coaxial electrode. The polar plot shows the microwave electromagnetic field emission about the coaxial electrode. This region is where the microwaves couple with the gas to generate the plasma jet. Then secondly an OES technique was used to create spatial maps of the photonic intensity distribution within the plasma jet when different additional gases were injected into it5.
2. Microwave Spectrum Analysis
2.1 Experimental Setup
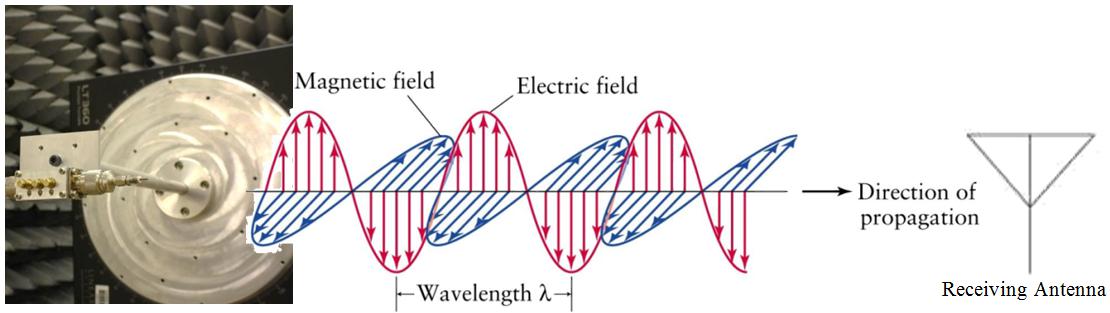
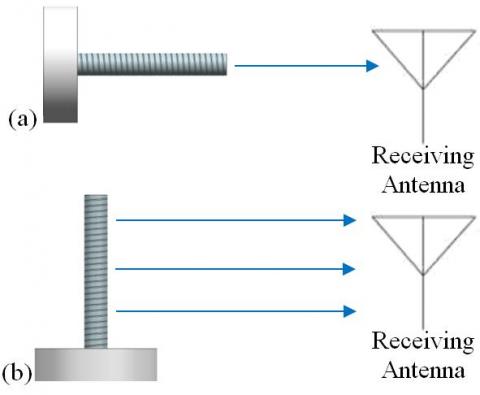
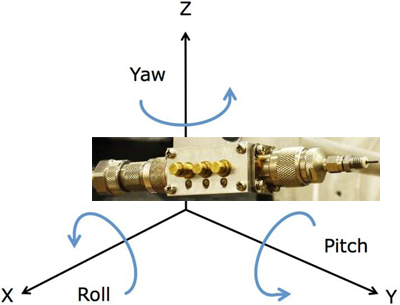
The previous experiments were conducted where the precision motion stage rotated the coaxial electrode through 90º pitch. To confirm that the electric field being emitted was axis symmetric, the above set of experiments where repeated where the setup was rotated through 90º yaw. The difference between pitch and yaw are shown in Figure 5 Roll, Pitch, Yaw.
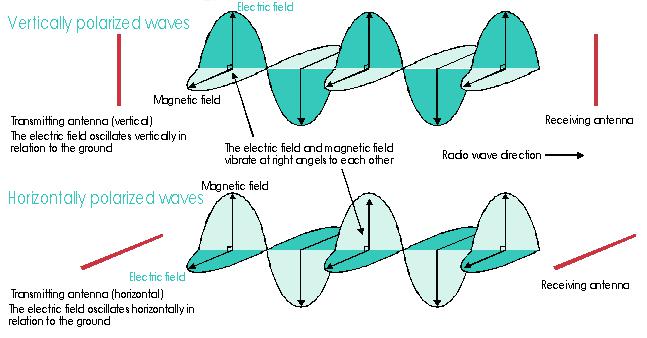
Finally the polarisation of the Military Standard receiving antenna was considered. All of the previous experiments rotating the setup through pitch and yaw, where conducted with the Military Standard receiving antenna was orientated to receive the horizontal polarisation of the electric field. To ascertain the polarisation of the electric field, the pitch and yaw experiments were repeated with the Military Standard receiving antenna in the vertical polarization state, rotated 90º relative to the horizontal polarisation. This is detailed in Figure 6 Vertical & Horizontal Polarisation.
2.2 Results
2.2.1 Axis Symmetry
3. Optical Emission Spectroscopy
3.1 Experimental Setup
3.2 Results
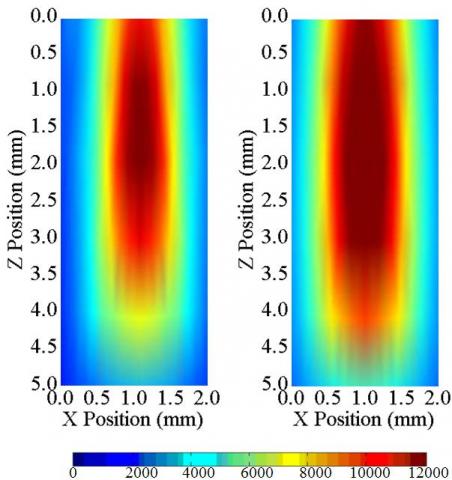
3.2.1 Argon Plasma Jet with Argon Gas Injected Downstream
3.2.2 Argon Plasma Jet with Sulphur Hexafluoride Gas Injected Downstream
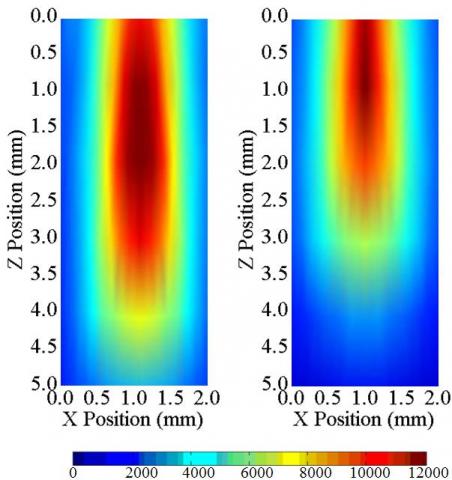
3.2.3 Argon Plasma Jet with Carbon Tetrafluoride Gas Injected Downstream
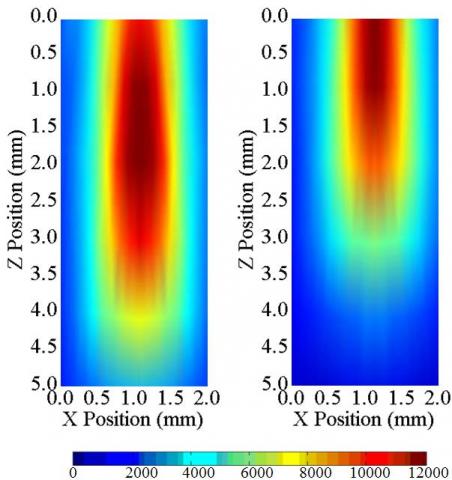
3.3 Analysis
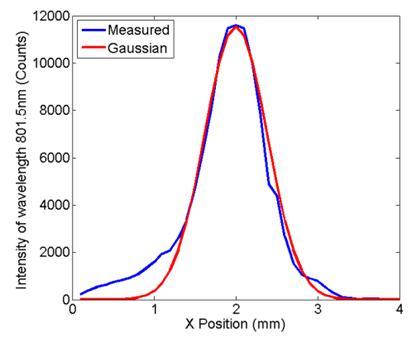
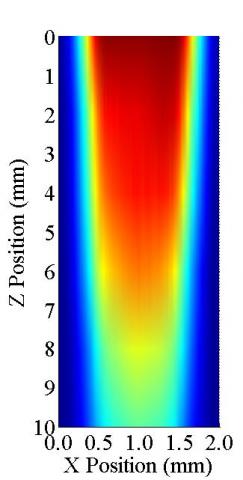
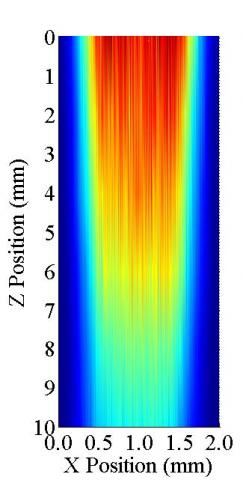
3.3.1 Argon Plasma Jet Cross Section
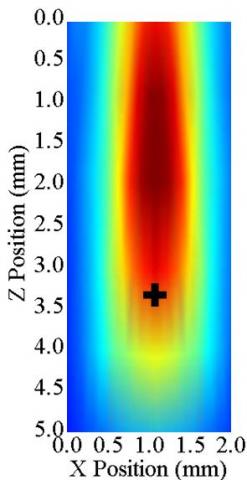
3.3.2 Analysis of a Stationary Locus within the Plasma Jet
Etching of optical surfaces using atmospheric pressure Surface Wave Launched Microwave Induced Plasma technology
Microwave Induced Plasma (MIP) technology has become the principal technology in the microwave plasma sector6. Typically a CE-MIP is used to couple microwaves into the gas, however the presence of reactive plasma interactions with the coaxial electrode’s surface typically results in electrode degradation. To avoid this degradation, a different plasma torch design that uses surface wave launching, which has previously been reported to discharge an argon plasma at atmospheric pressure, was chosen7.
Plasma Processing
Experimental Setup
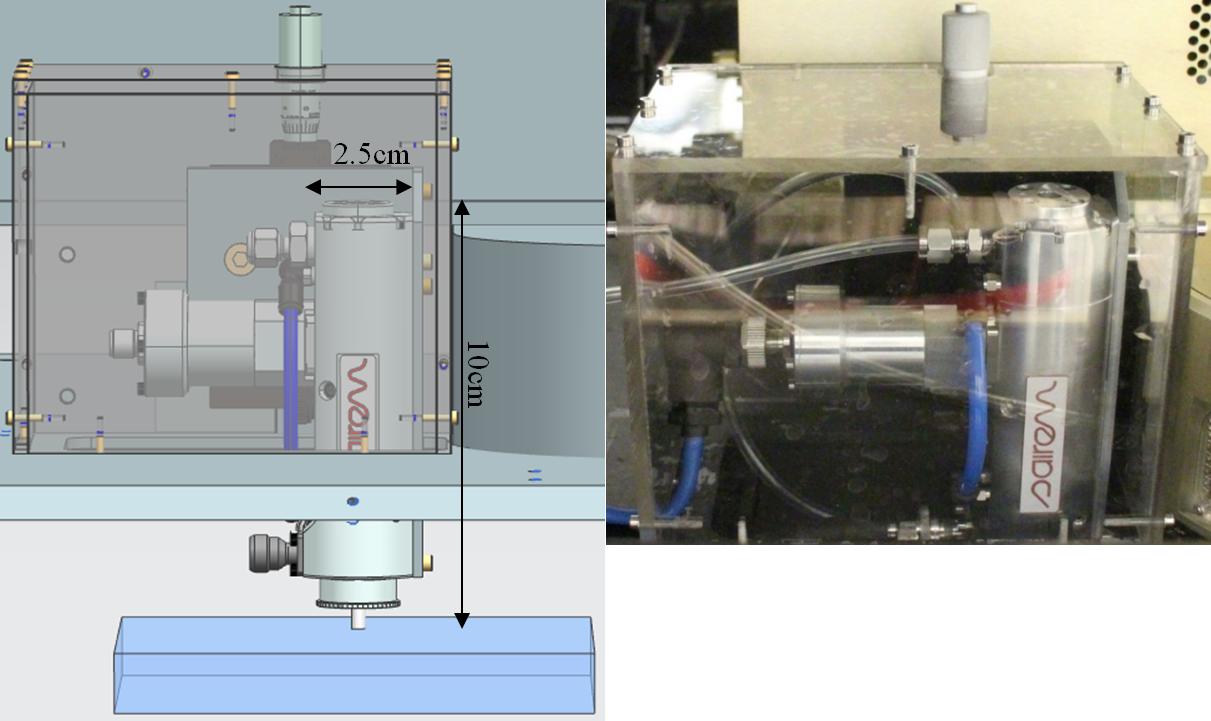
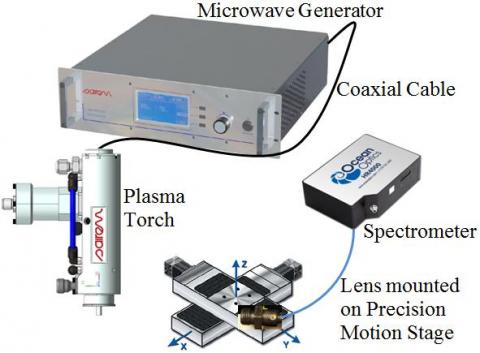
A Surface Wave Launched Microwave Induced Plasma torch was installed into an existing plasma figuring machine, as shown in Figure 17 Microwave Induced Plasma System. The plasma figuring machine had a rapid figuring capability for 300mm diameter optics.
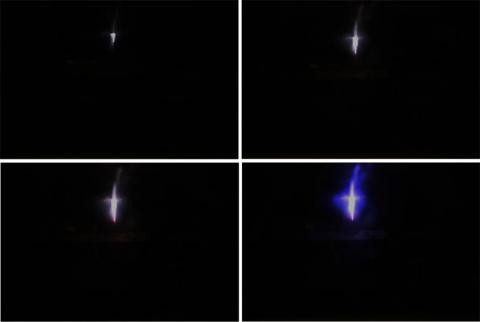
Plasma Jet Discharge
Interferometric Measurements
Surface characterisation was undertaken before and after each plasma processing stage, where the difference between the before and after measurements showed the surface change. Surface form characterisation was undertaken by using a Twyman-Green interferometer and surface roughness characterisation was performed by white-light interferometry with a Taylor Hobson CCI 6000 and a Nikon 50X magnification lens.
Stationary Dwells
Material Removal
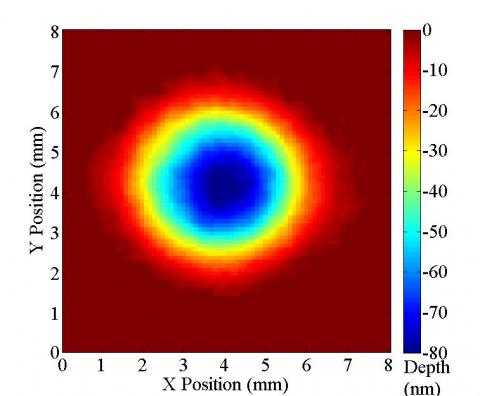
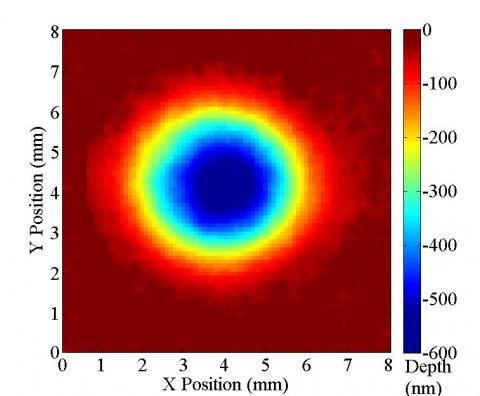
Figure 21 Stationary Dwell Power Investigation at 100W, 5L/min Ar + 0.5L/min CF4, stand-off distance 10mm, dwell time 10s - Cross Section shows the cross section of the stationary dwell conducted at 100W in Figure 19 . The footprint is Gaussian and has a FWHM of 2.7mm
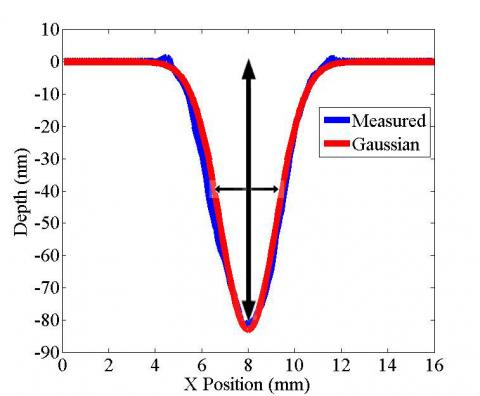
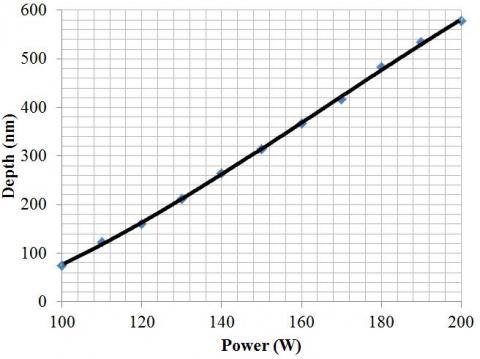
Figure 22 shows the effect on the maximum depth when the power is increased from 100W to 200W, at 10W intervals. The results of which are shown in .
Table 1 Stationary Etch Dwell Power Investigation at 5L/min Ar + 0.5L/min CF4, stand-off distance 10mm, dwell time 10s
|
Power (W) |
Etch Depth (nm) |
FWHM (mm) |
ΔFWHM (%) |
Sk2 |
|
100 |
74 |
2.7 |
1 |
0.0255 |
|
110 |
123 |
2.7 |
1 |
0.0255 |
|
120 |
161 |
2.7 |
1 |
0.0255 |
|
130 |
211 |
2.7 |
1 |
0.0255 |
|
140 |
265 |
2.8 |
1 |
0.0256 |
|
150 |
314 |
2.8 |
1 |
0.0256 |
|
160 |
367 |
2.8 |
1 |
0.0256 |
|
170 |
417 |
2.8 |
1 |
0.0256 |
|
180 |
483 |
2.9 |
1 |
0.0257 |
|
190 |
534 |
3.0 |
1 |
0.0258 |
|
200 |
578 |
3.1 |
1 |
0.0259 |
ΔFWHM = Difference between FWHM in x axis and FWHM in y axis
Sk2 = Pearson's Second Skewness Coefficient8 vector
FWHM values are calculated from theoretical Gaussian distribution
Single Trenches
Material Removal
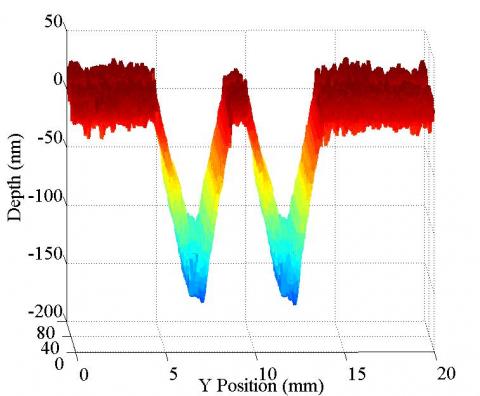
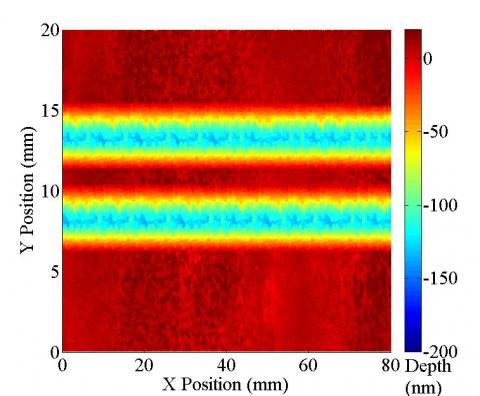
The FWHM of the trenches was 2mm.
Stationary Dwells
Material Deposition
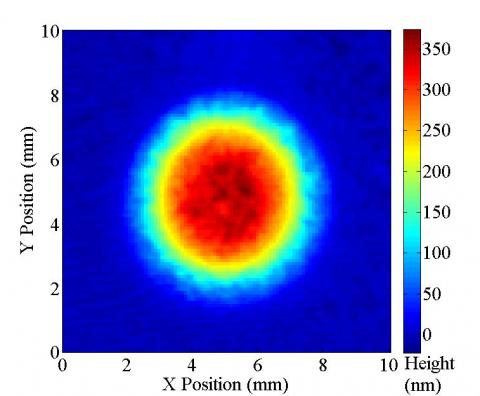
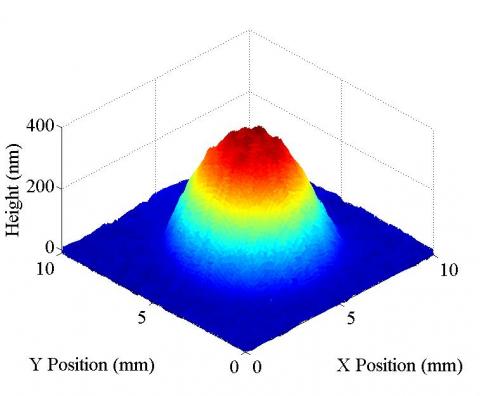
Table 2 Stationary Deposition Dwell Argon Gas Flow Investigation at 150W, 0.5L/min CF4, stand-off distance 10mm, dwell time 10s
|
Argon Gas Flow (L/min) |
Deposition Height (nm) |
FWHM (mm) |
ΔFWHM (%) |
Sk2 |
|
3 |
371 |
3.65 |
9 |
1.5341 |
Optical Emission Spectroscopy
Experimental Setup
Results
Carbon Tetrafluoride Gas Flow Investigation
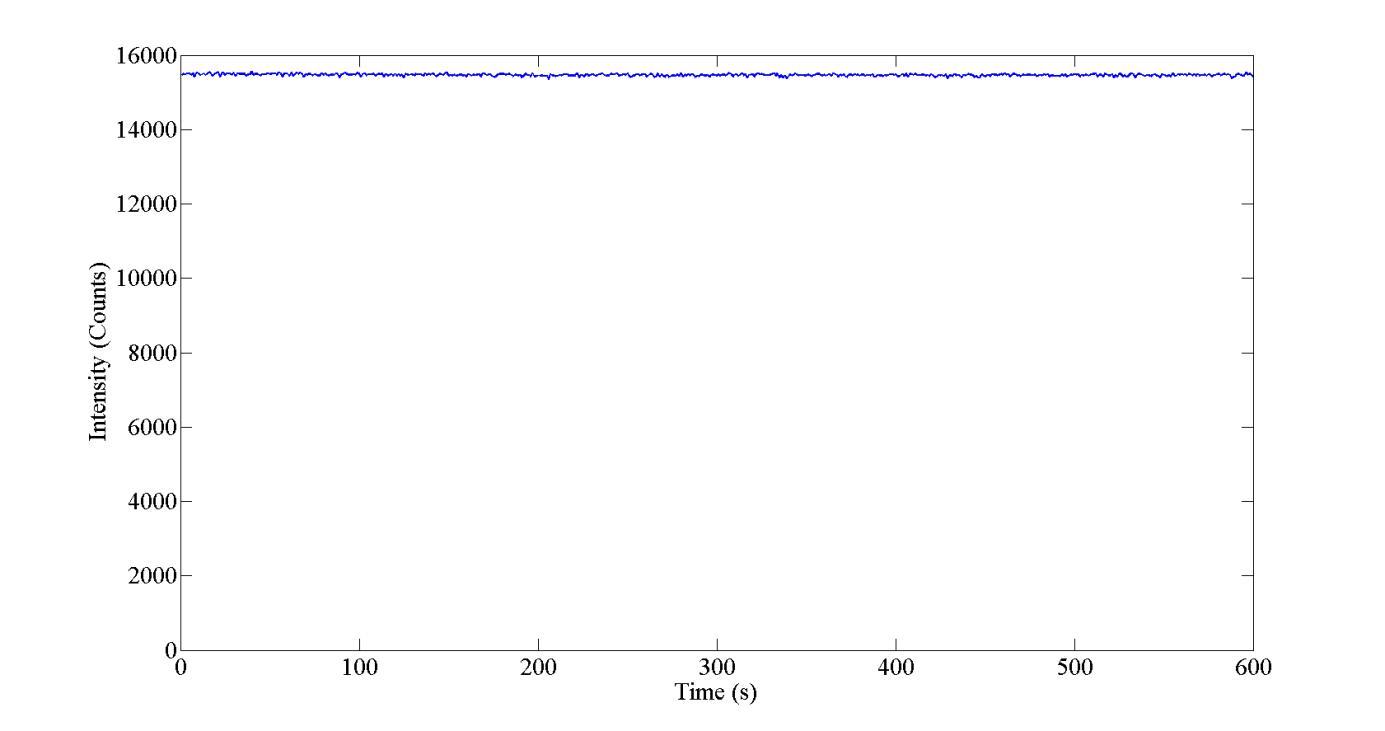
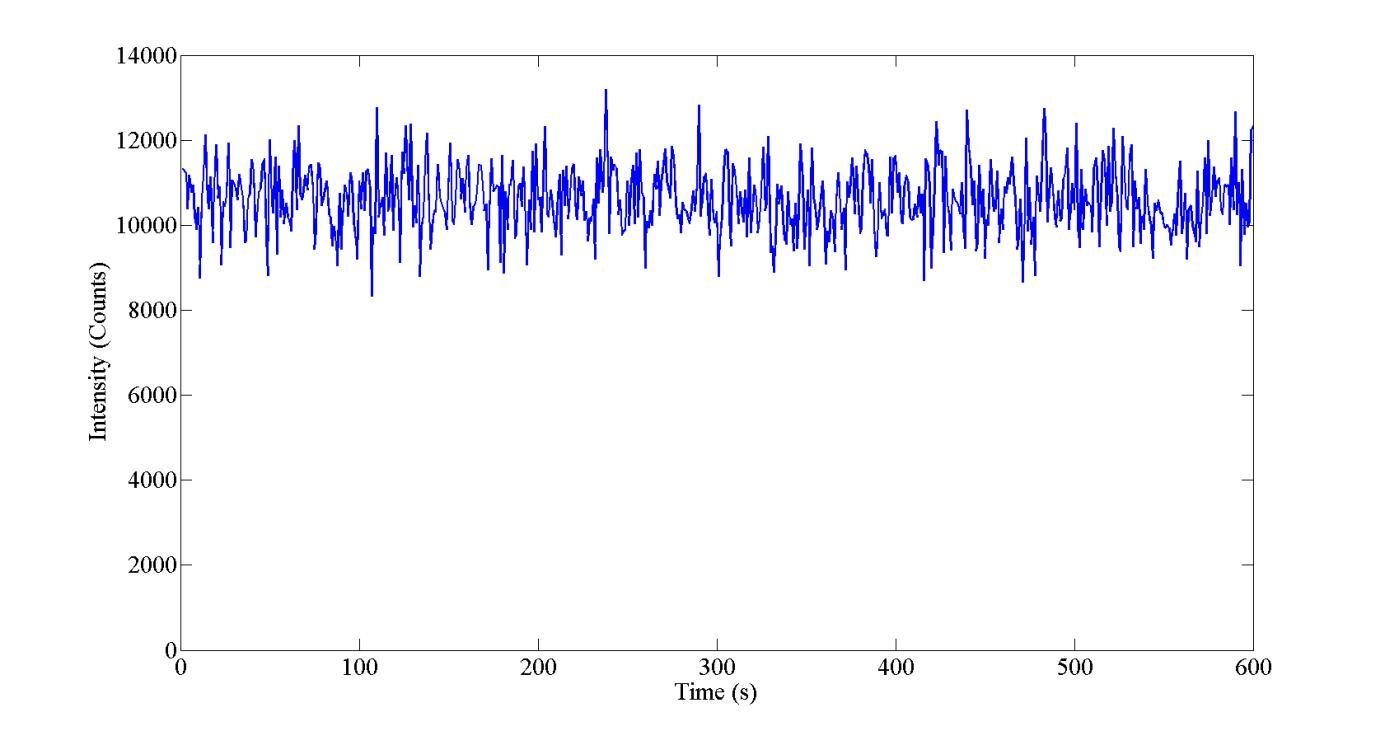
Plasma Jet Stability
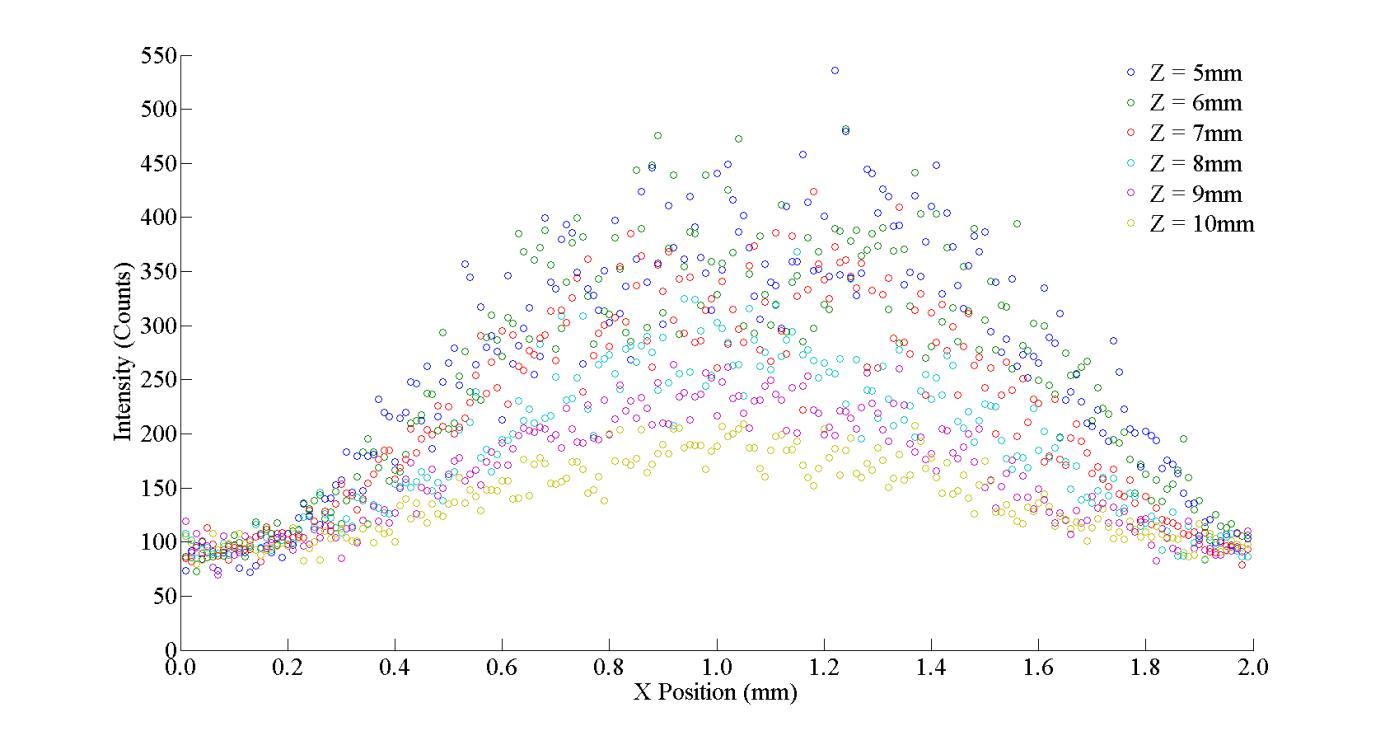
Carbon Tetrafluoride Distribution Within The Argon Plasma Jet

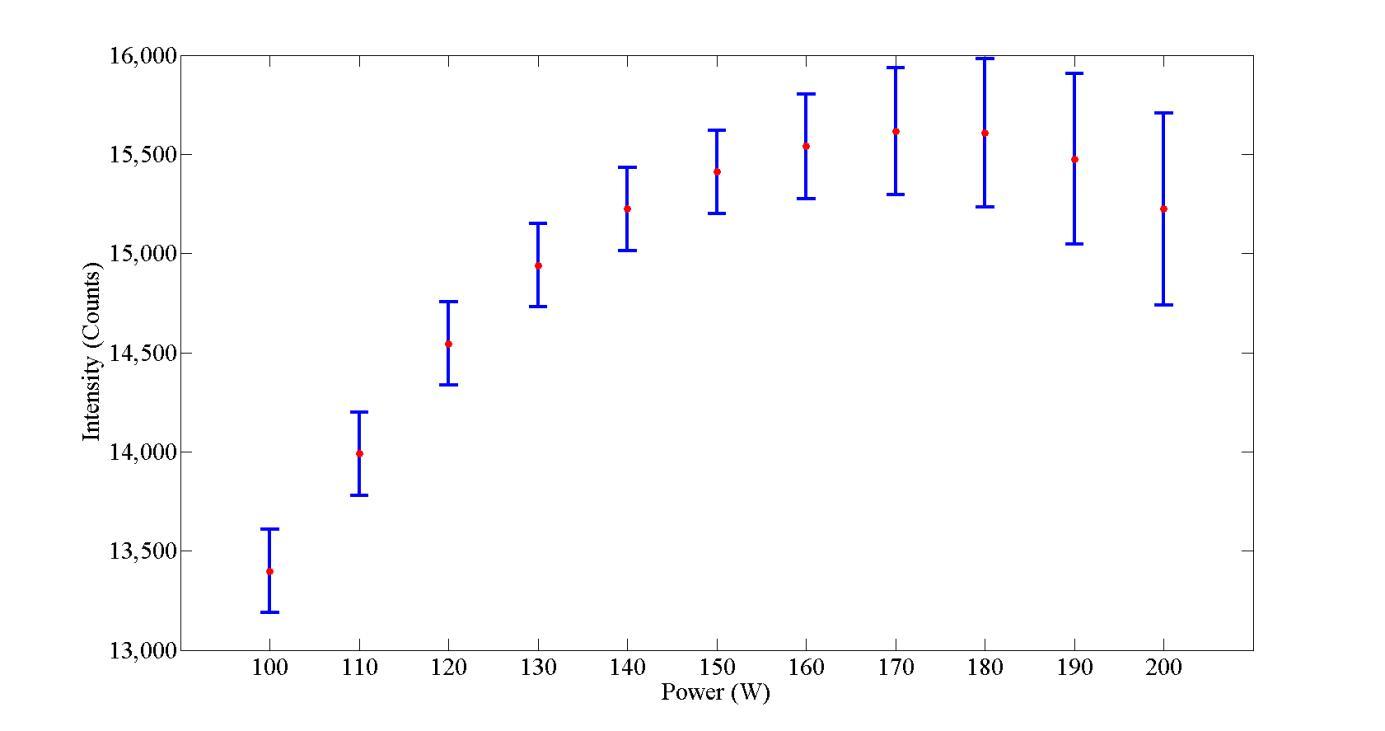
Power Investigation
Conclusion
A novel characterisation technique for a Coaxial Electrode Microwave Induced Plasma (CE-MIP) torch was developed using spectrum analysis and optical emission spectroscopy. A polar plot of the microwave energy emitted from the coaxial electrode was created and indicates that the plasma will be generated in one of two distinctive spatial locations. This result can indicate whether the plasma jet will operate in confined or non-confined mode.
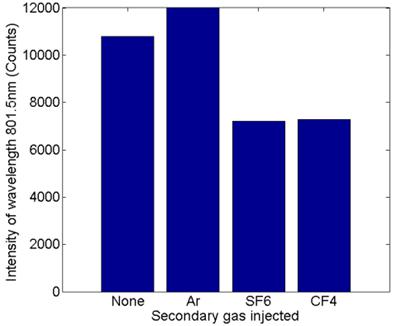
The photonic intensity spatial maps generated show how the photonic energy within the plasma jet varies when different secondary gases are injected. The distribution of the energy was near Gaussian. Furthermore, the injection of 1% argon secondary gas into the surface layer region of the argon plasma jet resulted in an increase of the relative intensity of the near infrared photon emission by 9%.
A prototype Surface Wave Launched Microwave Induced Plasma system has been modified to discharge reactive atom plasma for the targeted ultra-precision material removal of optical surfaces. A Design Of Experiments has been conducted investigating the full range of all parameters and the result has been used to optimise the system for material removal of crystal quartz.
Further investigation into crystal quartz processing is underway.
Acknowledgements
Funding: This work was supported by the UK EPSRC through the University Of Cambridge [EP/K503241/1]; and Cranfield University [EP/I033491/1]. The author would also like to thank Gooch & Housego for financial support.
Equipment: The author extends his thanks to ADTEC Europe for technical assistance and for the loan of the Coaxial Electrode Microwave Induced Plasma system.
- S. Moon et al., 2002, Characteristics of an atmospheric microwave-induced plasma generated in ambient air by an argon discharge excited in an open-ended dielectric discharge tube, AIP Journal: Physics of Plasmas, Volume 9, 4045
- K. Jankowski et E. Reszke, 2011, Microwave Induced Plasma Analytical Spectrometry, RSC Publishing, 1 – 36
- B. Smith et M. Carpentier, 1993, The Microwave Engineering Handbook: Microwave circuits, antennas and propagation, Volume 2, 4.14: Microwave measurements
- A. Balleri, 2017, Coordination of optimal guidance law and adaptive radiated waveform for interception and rendezvous problems, IET Radar, Sonar & Navigation,
- C. Yubero et al., 2017, Gas temperature determination in an argon non-thermal plasma at atmospheric pressure from broadenings of atomic emission lines, Spectrochimica Acta Part B, Volume 129, 14 – 20
- K. Jankowski et E. Reszke, 2011, Microwave Induced Plasma Analytical Spectrometry, RSC Publishing, 1 – 36
- J. Amorim et al., 2015, Plasma Physics and Controlled Fusion, 57, 074001
- D. Doane, et E. Lori, 2011, Measuring Skewness: A Forgotten Statistic?, Journal of Statistics